Zhi Shen Yong
My name is Zhi Shen Yong and I am a software developer. Here you can find a few of the projects I have worked on in the past. Please feel free to contact me for any additional information.
20 April 2018
Documentation: Remote Environment Monitoring System
Contact me for the full repository.
The Remote Environment Monitoring System helps users monitor the temperature and humidity of a location, or multiple locations, in a convenient and maintenance-free manner.
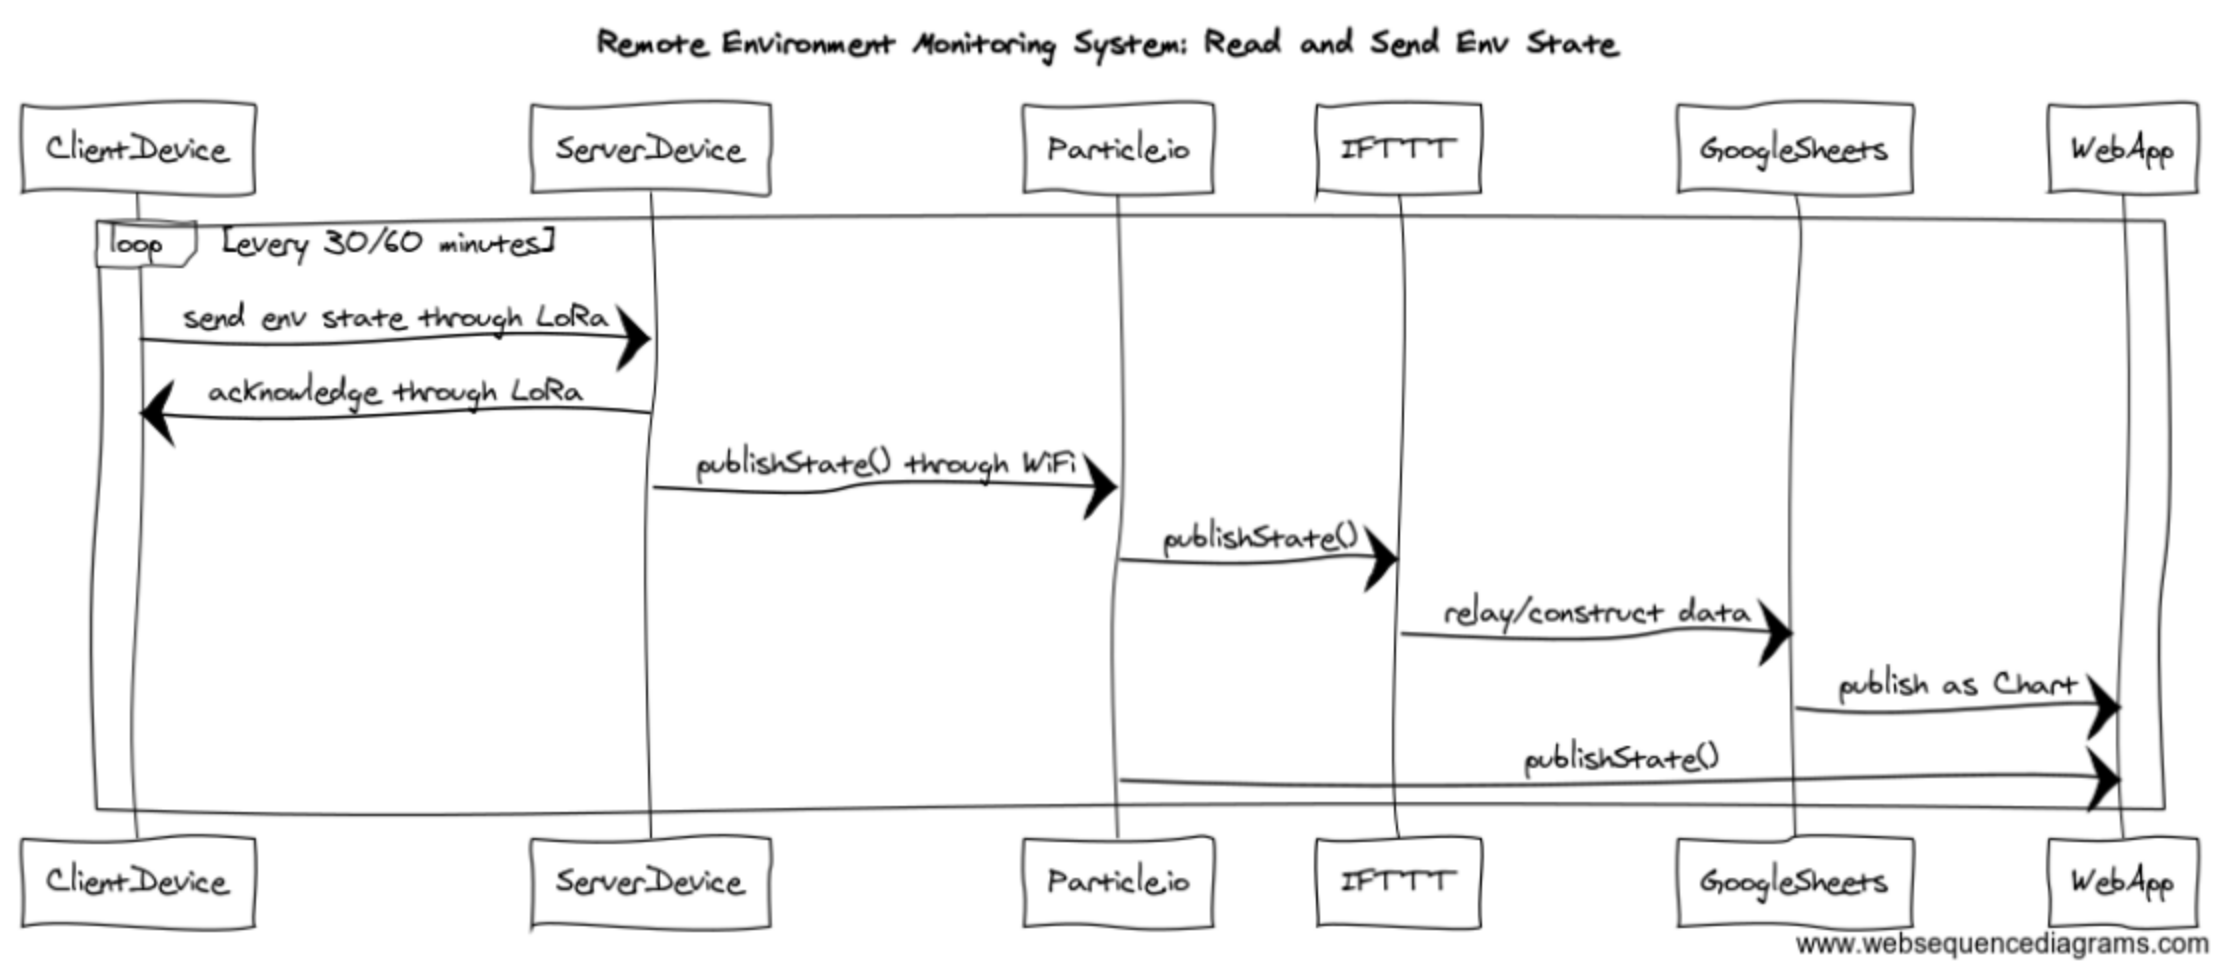
The simplest system uses two Particle Photon devices. One of these devices is the client, which acts as the remote data collector, periodically sending the data it collects to a central hub. The other device is the server, or the central hub, which continuously listens for incoming messages from clients. The server then uploads the data for a web application to display. A more complex system can use multiple clients and possibly multiple servers. Below is a sequence diagram of the simplest system. I will elaborate on each of the processes shown in the sequence diagram below in later sections.
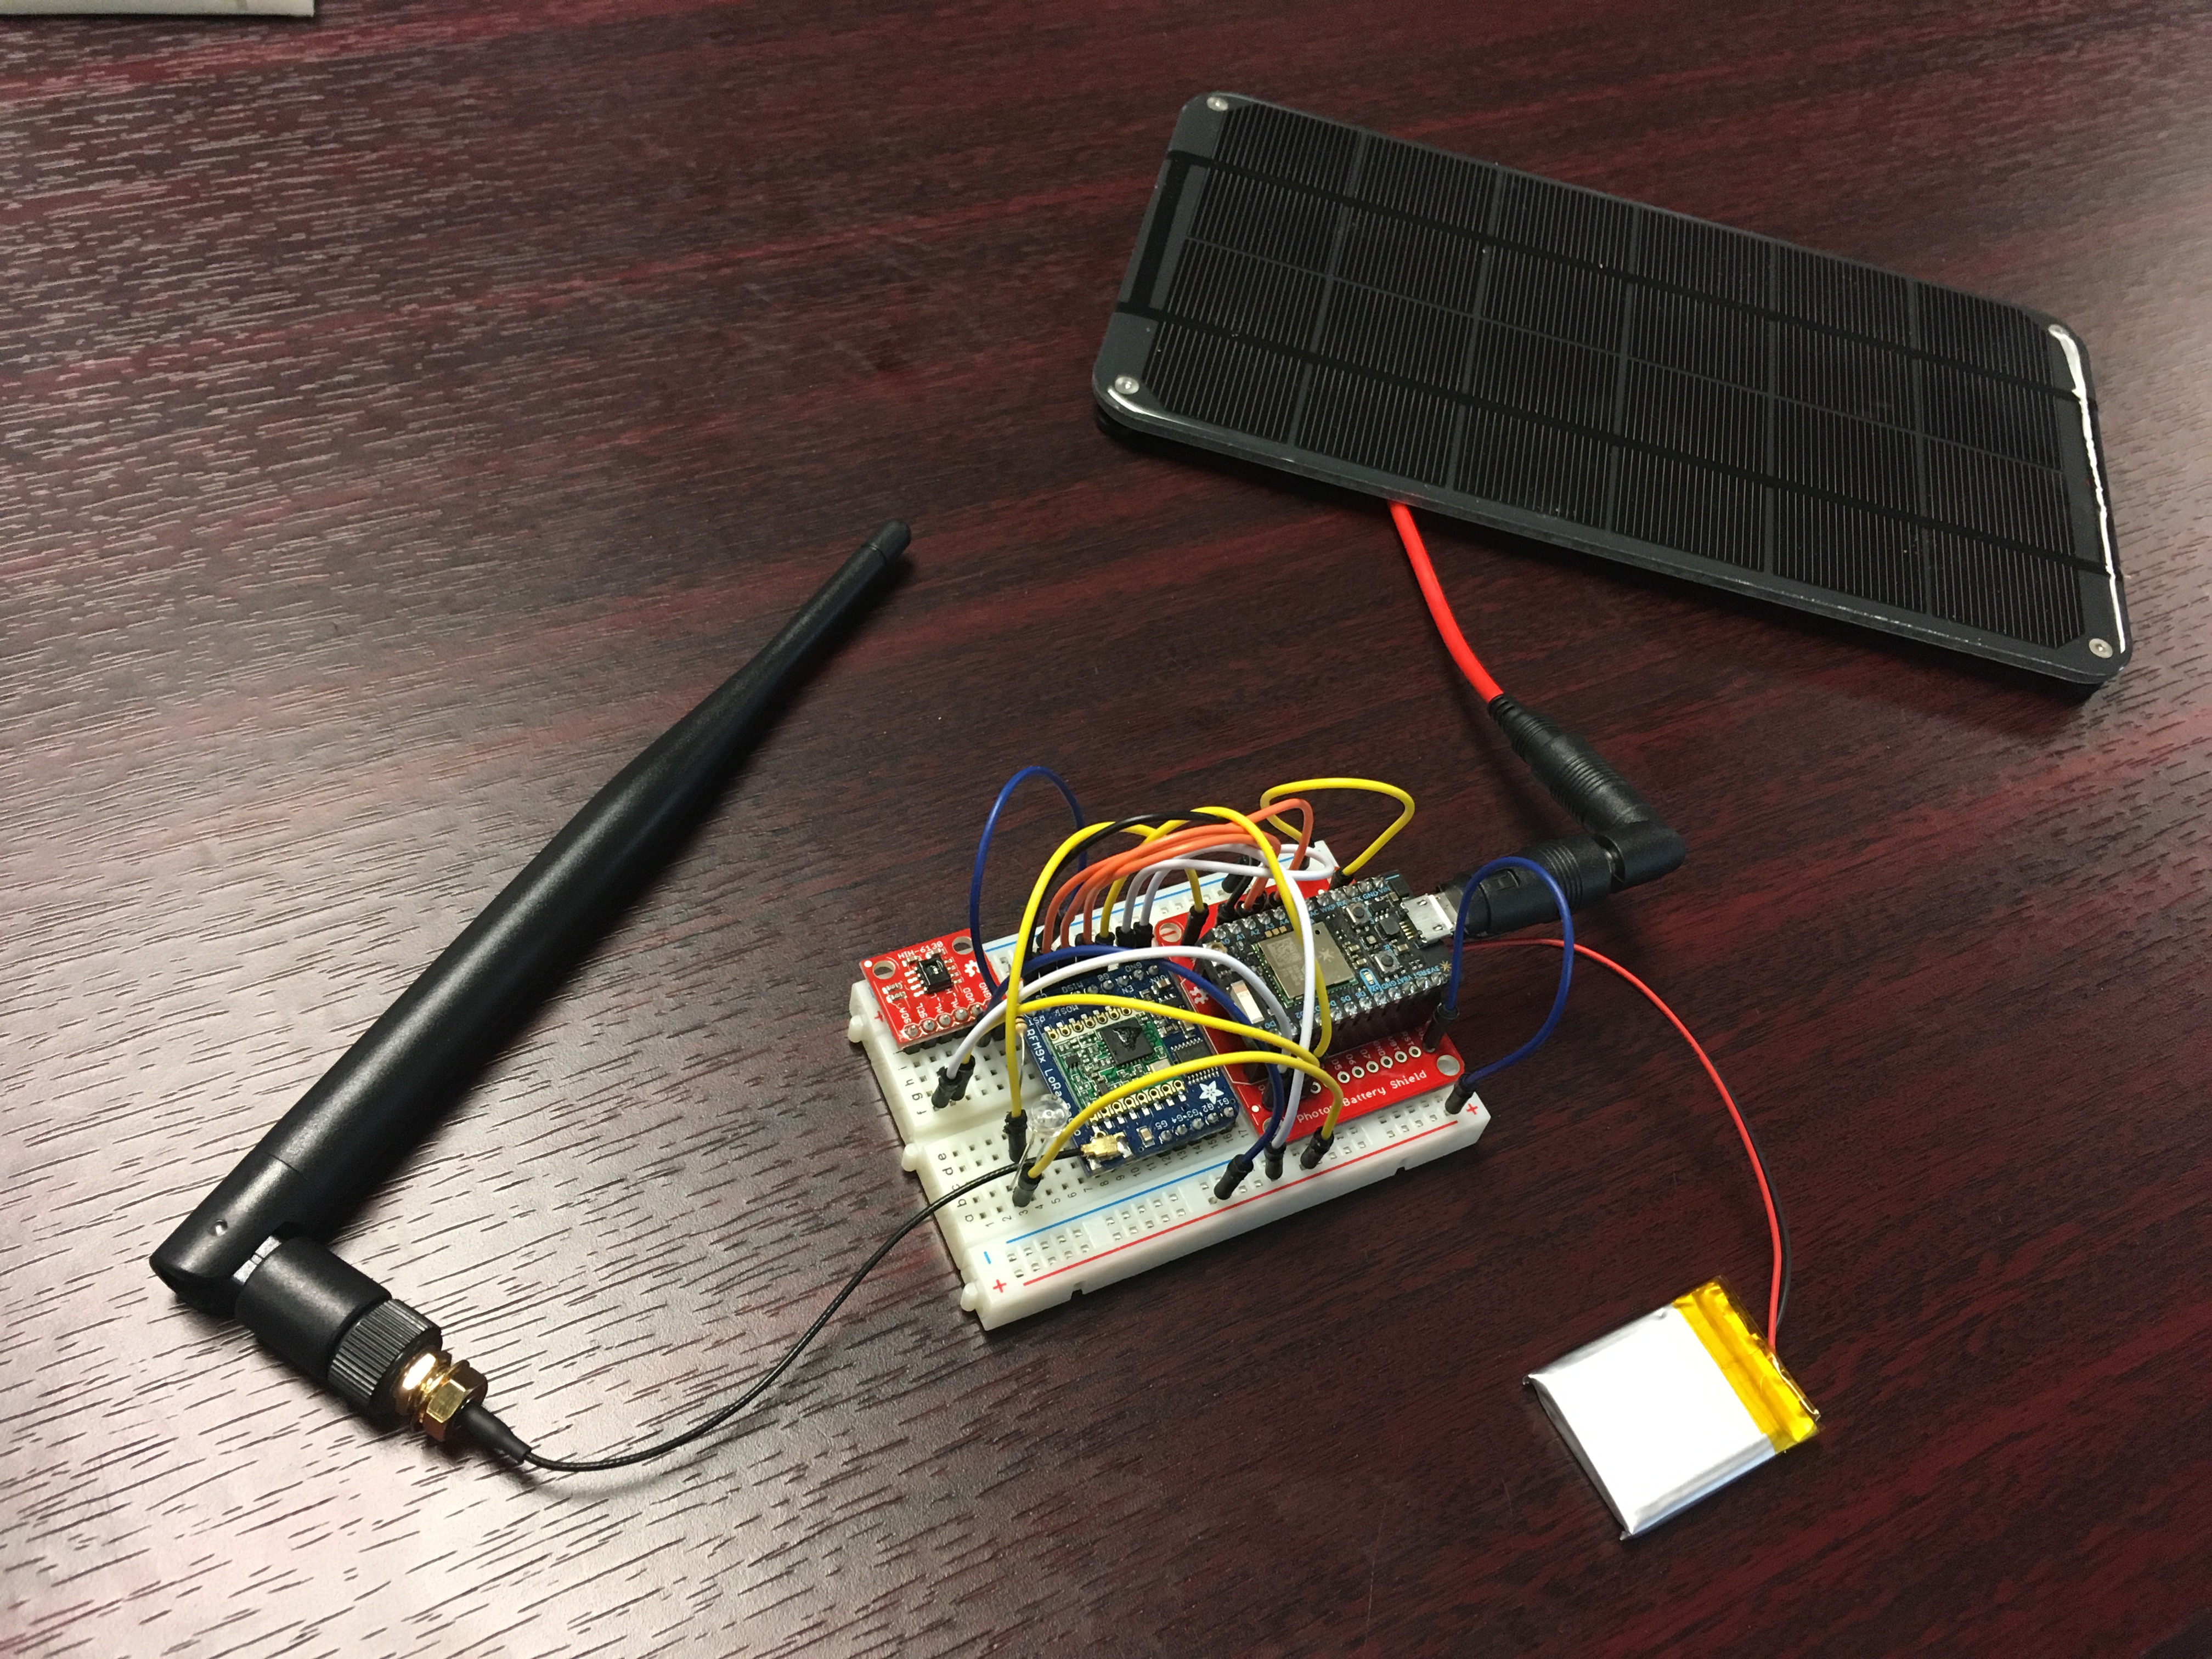
A client is fitted with a number of different sensors for data collection. Here I used a temperature and humidity sensor, but any other kind of sensor, such as a VOC sensor or a LPG sensor, will work. To transmit the information it collects, the client uses a radio transceiver, and in order to operate remotely, the client uses a LiPo battery and a solar cell.
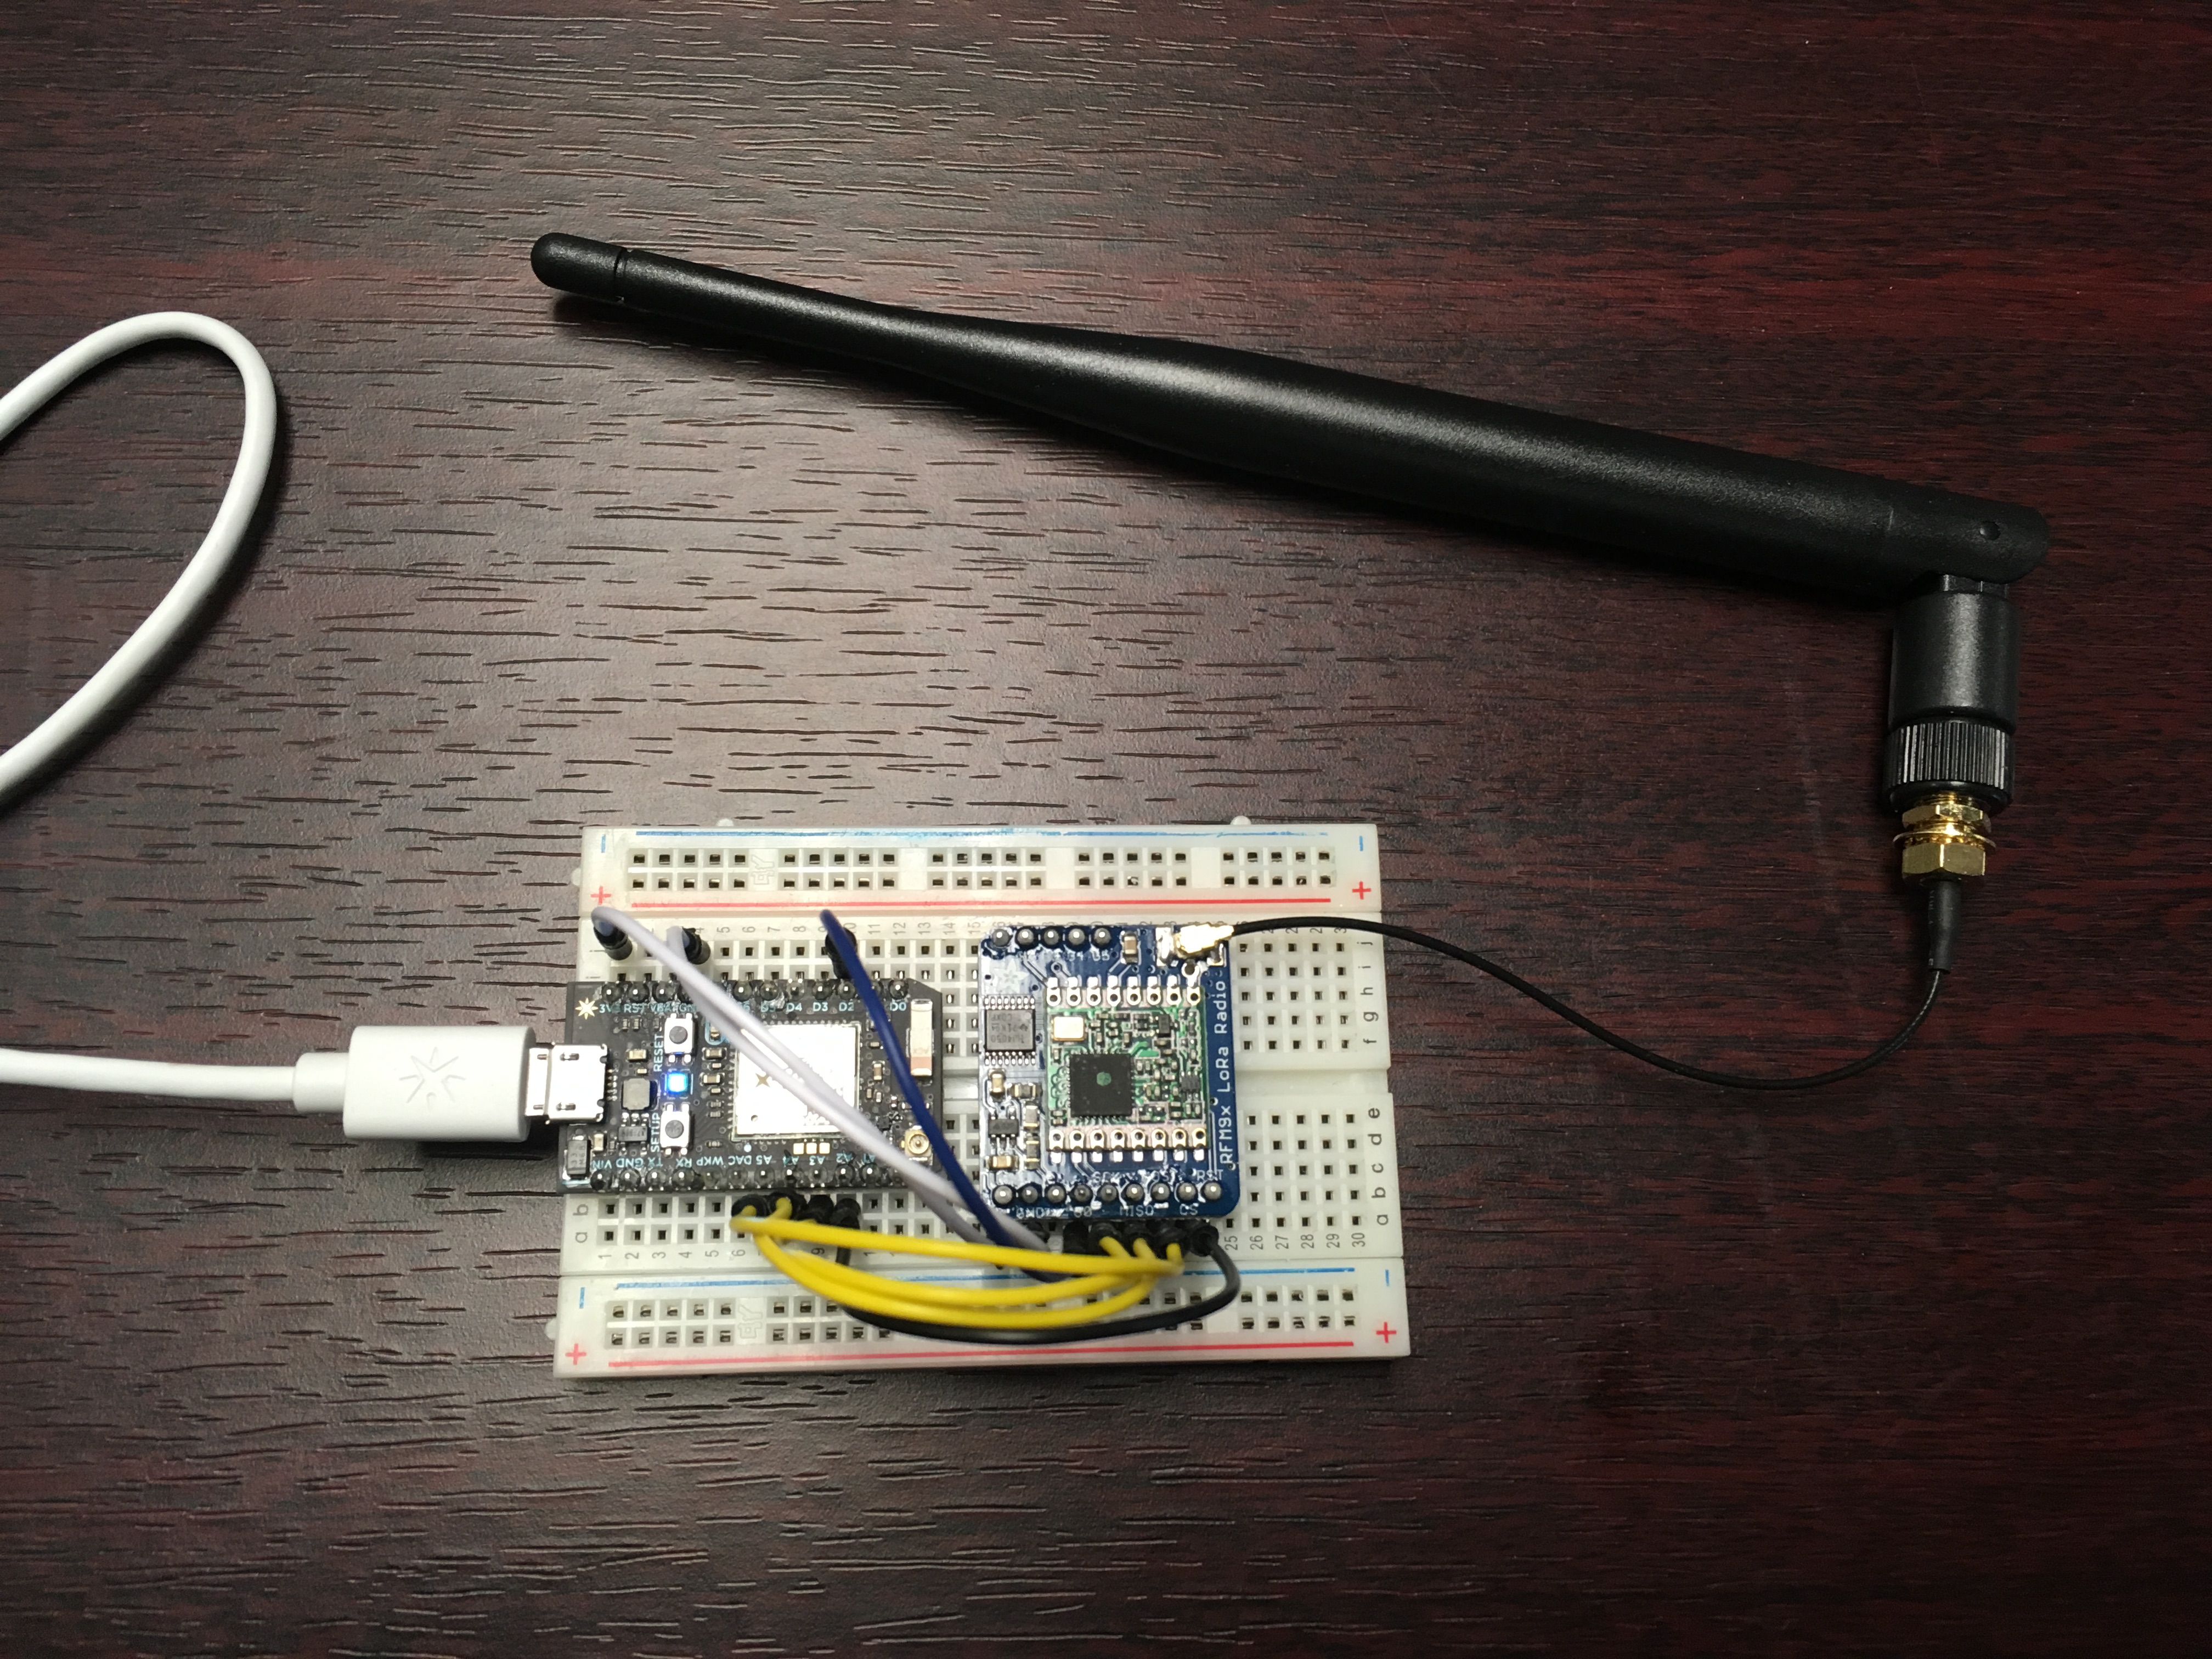
A server, on the other hand, is fitted with just a radio transceiver to receive messages from clients and send out acknowledgement messages in return. Although clients may be fitted differently depending on the situation, the server design will likely remain the same.
Below is a list of hardware used in the system I experimented with.
| Other Items |
|---|
| 0.1” Pitch Headers |
| Soldering Kit (any soldering kit works) |
| Breadboard (included in Particle Photon purchase) |
| Jumper Wires |
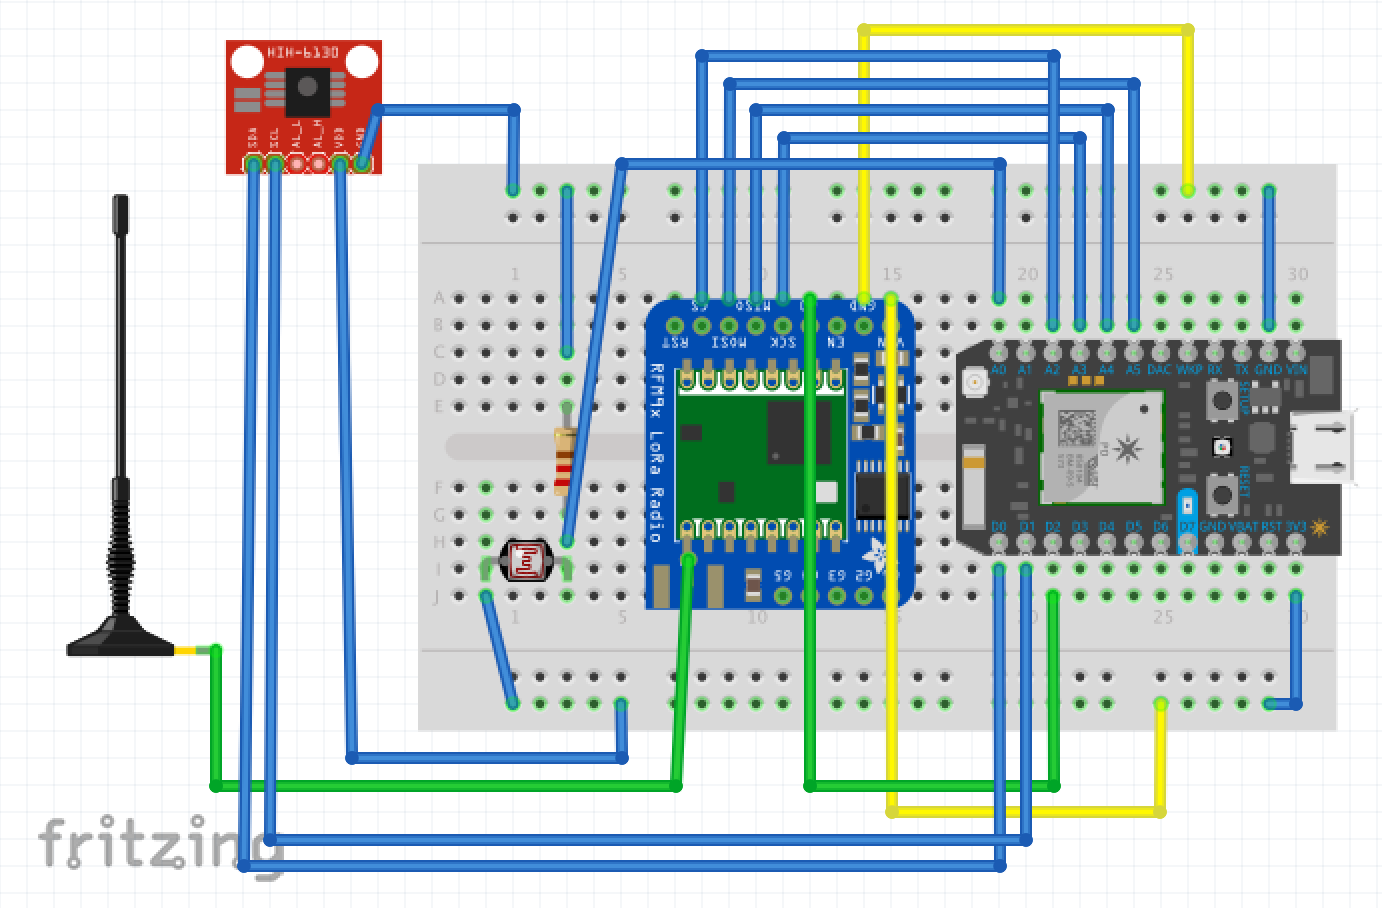
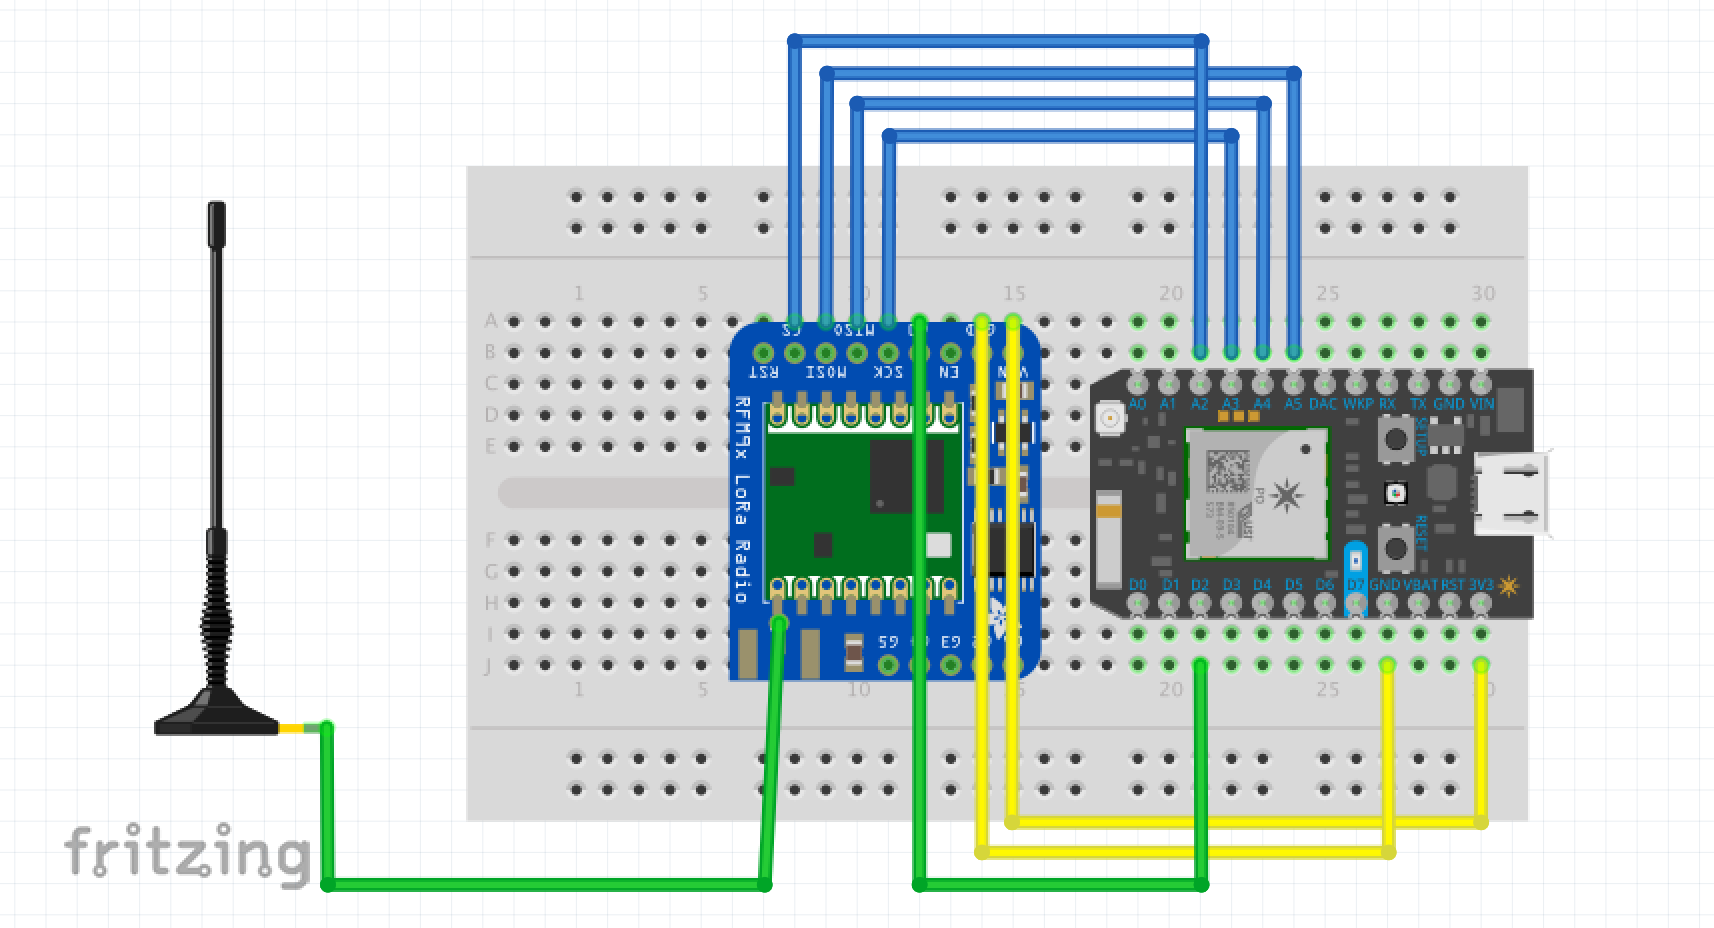
I configured the client as shown in the diagram below.
Notes:
- IMPORTANT! The Particle Photon should be connected to the Photon Battery Shield before being connected to the breadboard. This allows the connection of the 400mAh LiPo Battery and the 3.5W Solar Cell at a later time. Note that the Photon Battery Shield is not shown in circuit diagram but is required in any implementation of the client that uses a battery as a power source.
- The configuration shown above may change if a different microcontroller is used (e.g., Arduino Uno).
- The Particle Photon supports both SPI and I²C connections.
- Other sensors can be used instead of the Humidity/Temperature Sensor and PhotoTransistor.
- The uFL SMT Antenna Connector should be soldered onto the RFM95W LoRa Transceiver before the 900Mhz Antenna Kit is attached (directions found here).
The server is configured as shown in the diagram below.
Notes:
- The configuration shown above may change if a different microcontroller is used (e.g., Arduino Uno).
- The uFL SMT Antenna Connector should be soldered onto the RFM95W LoRa Transceiver before the 900Mhz Antenna Kit is attached (directions found here).
Instructions here (or in the code snippet below) show how to operate the Humidity/Temperature Sensor. If multiple I²C sensors are connected, you may need to verify that sensor addresses do not conflict. Follow this link to find code for scanning for connected I²C devices (Particle Photon only).
client.ino
#include "application.h" // required to communicate through i2c
#include "cactus_io_HIH6130.h" // imported sensor library

byte address = 0x27; // default sensor address
HIH6130 hih6130(address); // initialize sensor

void setup() {
  Wire.begin(); // start i2c connection
  Serial.begin(9600); // connect to serial monitor
}

void loop() {
  hih6130.readSensor(); // get current readings
  Serial.println(hih6130.humidity); // display humidity
  Serial.println(hih6130.temperature_C); // display temperature
  delay(1000);
}
If the Humidity/Temperature Sensor is working properly, reasonable values for temperature and relative humidity should be showing on the serial monitor.
The code snippet below shows how to operate the PhotoTransistor.
client.ino
const int transistorPin = A0; // phototransistor wired to A0

void setup() {
  pinMode(A0, INPUT); // set pin to input mode
  Serial.begin(9600); // connect to serial monitor
}

void loop() {
  int transistorReading = analogRead(transistorPin); // get reading
  Serial.println(transistorReading); // print reading
  delay(1000);
}
If the PhotoTransistor is working properly, you should be able to cover the PhotoTransistor or turn off the lights and see the new values shown on the serial monitor decrease.
Note that using different sensors with the client will require different setups.
It is also important to make sure the Photon Battery Shield is working. The Photon Battery Shield should be mounted to the breadboard, with the Particle Photon mounted on top of the Photon Battery Shield. Connect the 400mAh LiPo Battery to the back of the Photon Battery Shield, the DC Plug to MicroUSB to the MicroUSB plug of the Particle Photon, and then the 3.5W Solar Cell to the DC Plug to MicroUSB.
The Particle Photon will automatically boot if the 400mAh LiPo Battery has any charge. If there is enough sunlight a small red LED at the back of the Photon Battery Shield will light up, indicating that the system is being charged.
The supporting library for the Photon Battery Shield allows us to read the current charge of the connected 400mAh LiPo Battery as well as the system’s voltage.
Instructions here (or in the code snippet below) show how to operate the Photon Battery Shield.
client.ino
#include "SparkFunMAX17043.h" // battery shield library

void setup() {
  lipo.begin(); // setup lipo gauge
  lipo.quickStart();
  Serial.begin(9600); // connect to serial monitor
}

void loop() {
  int soc = lipo.getSOC(); // get state of charge
  Serial.println(soc);
  delay(1000);
}
If the Photon Battery Shield is working properly the serial monitor should be showing a percentage value, which is the battery’s state of charge. This value should slowly decrease, unless the 3.5W Solar Cell connected to the system is left in sunlight.
The RFM95W LoRa Transceivers will allow the client and server to communicate, and require the RadioHead library to operate. The code snippet below tells the client to send messages to the server, and the server to send acknowledgement messages back to the client.
client.ino
#include "RHReliableDatagram.h" // reliable datagram driver
#include "RH_RF95.h" // unreliable datagram driver

#define CLIENT_ADDRESS 1
#define SERVER_ADDRESS 2

RH_RF95 driver; // initialize radio driver
RHReliableDatagram manager(driver, CLIENT_ADDRESS);
uint8_t buf[RH_R95_MAX_MESSAGE_LEN]; // message receiver

void setup() {
  Serial.begin(9600); // connect to serial monitor
  if (!manager.init()) { // initialize radio manager
    Serial.println("Initialization failed!");
  }
  driver.setTxPower(23, false); // set max transmitter power
  driver.setFrequency(915.0); // set frequency
  delay(2000);
}

void loop() {
  String messageToSend = "Hello World!";
  char packet[20]; // default packet length 20
  messageToSend.toCharArray(packet, 20);
  packet[19] = 0; // null-terminate array
  if (manager.sendtoWait((uint8_t *)packet, sizeof(radiopacket), SERVER_ADDRESS)) { // send the message
    uint8_t len = sizeof(buf);
    uint8_t from;
    delay(10);
    if (manager.recvfromAckTimeout(buf, &len, 2000, &from)) { // acknowledgement
      Serial.println((char*)buf); // print acknowledgement message
      Serial.println(driver.lastRssi(), DEC); // print signal strength
    } else {
      Serial.println("No reply."); // no reply from server
    }
  }
  delay(5000); // send a message every 5 seconds
}
server.ino
#include "RHReliableDatagram.h" // reliable datagram driver
#include "RH_RF95.h" // unreliable datagram driver

#define CLIENT_ADDRESS 1
#define SERVER_ADDRESS 2

RH_RF95 driver; // initialize radio driver
RHReliableDatagram manager(driver, SERVER_ADDRESS);

uint8_t data[] = "Hello client!"; // acknowledgement message
uint8_t buf[RH_R95_MAX_MESSAGE_LEN];

void setup() {
  Serial.begin(9600); // connect to serial monitor
  if (!manager.init()) { // initialize radio manager
    Serial.println("Initialization failed!");
  }
  driver.setTxPower(23, false); // set max transmitter power
  driver.setFrequency(915.0); // set frequency
  delay(2000);
}

void loop() {
  if (manager.available()) { // wait for a new message
    uint8_t len = sizeof(buf);
    uint8_t from;
    if (manager.recvfromAck(buf, &len, &from)) { // receive message
      String receivedMessage((char*)buf);
      Serial.println(receivedMessage); // print message
      if (!manager.sendtoWait(data, sizeof(data), from)) { // send reply
        Serial.println("Acknowledgement message not able to send.");
      }
    }
  }
  delay(10);
}
With this code, the client will send a "Hello World!" message every 5 seconds to any listening servers, and after sending each message, the client will wait up to 2 seconds for any incoming acknowledgement messages. The server, on the other hand, will constantly listen for incoming messages, whereupon receiving a message it prints out the message and sends out an acknowledgement message to the specific client that sent the incoming message.
With some String concatenation and manipulation, the code for the sensors and the RFM95W LoRa Transceivers can be combined so every 5 seconds, the client constructs a message that includes readings from the Humidity/Temperature Sensor and PhotoTransistor and sends the message to the server. The server parses these messages and prints them out in the serial monitor. To parse a String object, use indexOf() and substring().
// given numerical sensor readings, sum them together as a String
String packet = battery + "," + humidity + "," + temperature + "," + light;

// given String in csv format where the number of values are known,
// this is a method for parsing the String
String receivedString((char*)buf);
int firstCommaIndex = receivedString.indexOf(',');
int secondCommaIndex = receivedString.indexOf(',', firstCommaIndex+1);
int thirdCommaIndex = receivedString.indexOf(',', secondCommaIndex+1);
String battery = receivedString.substring(0, firstCommaIndex);
String humidity = receivedString.substring(firstCommaIndex+1, secondCommaIndex);
String temperature = receivedString.substring(secondCommaIndex+1, thirdCommaIndex);
String light = receivedString.substring(thirdCommaIndex+1);
Since the client can operate remotely due to the 400mAh LiPo Battery and 3.5W Solar Cell, it can be placed at any reasonable distance from the server, and the devices should still communicate. The RFM95W LoRa Transceivers have an approximate range of 2 kilometers in an urban environment, and up to 15 kilometers in an open environment.
Because of energy constraints, it is necessary to minimize the amount of time the client is powered. This is accomplished with the code snippet below.
System.sleep(SLEEP_MODE_DEEP, timeToSleep);
The variable timeToSleep is the amount of time in seconds to turn the device off. This replaces the delay() at the bottom of the code for the client. I found that the variable timeToSleep should not be set to a value less than 1800 (equal to 30 minutes), or the client will likely not be fully energy-maintenance-free.
An energy profile can be a good a backup solution to dull weather.
client.ino
soc = lipo.getSOC(); // get battery charge
if (((int)soc) > 60) { // more than 60% battery
  timeToSleep = 1800; // 30 minute cycles
} else if (((int)soc) > 30) { // more than 30% battery but less than 60% battery
  timeToSleep = 3600; // 1 hour cycles
} else { // less than 30% battery
  timeToSleep = 18000; // 5 hour cycles
}
The next step is to take the information received by the server and display it longitudinally and with memory on a web application. Particle Firmware supports publishing an event through the Particle Device Cloud, which will then be forwarded to any listeners. This is a perfect way of getting the data off the server device and onto the Internet.
server.ino
const String topic = "myProject"; // stream name

void setup() {
  Particle.function("publish", publish); // declare cloud function
}

void loop() {
  publish(""); // call the function every 5 seconds
  delay(5000);
}

int publish(String arg) {
  String messageToSend = "Hello World!"; // send this message
  Particle.publish(topic, messageToSend, 60, PRIVATE);
  return 0;
}
Adding this code to the previous code makes it so that instead of just displaying the sensor information on the server serial monitor, the sensor information is also uploaded to the Particle Device Cloud. From there, we can pull the data using WebHooks and other IOT Services such as Microsoft Azure and Google Cloud. Many IOT Services will allow you to funnel the data from the Particle Device Cloud into various tools included in the IOT Service.
If the goal is just to display current data, then the Particle API is a better solution. Using the API, a newly-opened web application can request the most recent sensor readings and will also update as new sensor readings are pushed to the Particle Device Cloud.
The code snippets below show how to set up a web application with the Particle API to request the most recent sensor readings when the application opens as well as pull new data whenever new data is pushed to the Particle Device Cloud.
app.js
// function that updates html when it is called
function stateChange(event) {
  document.getElementById("battery").innerHTML = event.battery;
  document.getElementById("humidity").innerHTML = event.humidity;
  document.getElementById("temperature").innerHTML = event.temperature;
  document.getElementById("light").innerHTML = event.light;
}
// set listener to run stateChange function when new event occurs
document.addEventListener("DOMContentLoaded", function(event)) {
  rems.setStateChangeListener(stateChange);
  rems.setup();
}
rems.js
var myParticleAccessToken = "YOUR_ACCESS_TOKEN_HERE"
var myDeviceId = "DEVICE_ID_HERE"
var topic = "myProject" // must be the same as stream name

// this is called when a new event is present on the stream
function newEvent(event) {
  var obj = JSON.parse(event.data);
  rems.battery = obj.battery;
  rems.humidity = obj.humidity;
  rems.temperature = obj.temperature;
  rems.light = obj.light;
  rems.stateUpdate();
}

// construct the system object
var rems = {
  battery: 0,
  temperature: 0,
  humidity: 0,
  light: 0,
  stateChangeListener: null,
  setStateChangeListener: function(listener) {
    this.stateChangeListener = listener;
  }
  stateUpdate: function() {
    if (this.stateChangeListener) {
      var state = {
        "battery": this.battery,
        "temperature": this.temperature,
        "humidity": this.humidity,
        "light": this.light
      };
      // pass updated state to app.js to update
      // the document accordingly
      this.stateChangeListener(state);
    }
  },
  setup: function() {
    particle = new Particle();
    function onSuccess(stream) {
      // assign newEvent() to the stream
      stream.on("event", newEvent);
      var functionData = {
        device: myDeviceId,
        name: "publish", // cloud function on server
        argument: "", // doesn't require an argument
        auth: myParticleAccessToken
      }
      // call the publish function to get initial data
      particle.callFunction(functionData);
    }
    function onFailure(e) {
      console.dir(e);
    }
    // get the event stream according to topic
    particle.getEventStream({
      name: topic,
      auth: myParticleAccessToken
    }).then(onSuccess, onFailure); // promise
  }
}
Every time the web application is opened, it calls the publish() function on the server device, which publishes the most recent sensor readings. This way, the web application is able to display the most recent sensor readings. When the client reads new data and the server pushes this data onto the Particle Device Cloud, the newEvent() function is called, which calls stateUpdate(), which then calls stateChange(). As a result, the values shown on the web application update.
A drawback of this method is that only the most recent data-point is displayed, so the information is not longitudinal. Also, every time the page is refreshed the information is refreshed as well, so this web application is without memory.
To allow the web application to display historical data, some kind of storage service is needed. Although many IOT Services offer their own storage service, I found Google Sheets to be the perfect solution for the purposes of this project, since all we need is a place to store numerical values.
To automatically store sensor data in Google Sheets when the client reads and the server pushes, I used IFTTT to create an applet that responds to events pushed under the relevant topic name by parsing the event message and storing it in Google Sheets.
Finally, I used Google Charts, which works very well with Google Sheets, to pull the sensor information, row by row, from the relevant Sheets document. An example is shown in the code snippet below.
graphs.js
google.charts.load("current", {"packages":["corechart"]});
google.charts.setOnLoadCallback(drawChart); // call drawChart when loaded

function drawChart() {
  var query = encodeURIComponent("SELECT D, G, J"); // select columns needed
  // construct the query
  var humidityQuery = new google.visualization.Query("https://docs.google.com/spreadsheets/d/YOUR_LINK_HERE/gviz/tq?gid=0&headers=1&tq=" + query);
  humidityQuery.send(humidityHandler); // send query to handler
}

function humidityHandler(response) {
  var data = response.getDataTable();
  var options = {  // some options for how the graph will look
    "title": "Relative Humidity",
    titleTextStyle: {
      fontSize: 16
    },
    vAxis: {
      title: "Percentage"
    },
    legend: {
      position: "top"
    }
  }
  // draw the chart!
  var chart = new google.visualization.LineChart(document.getElementById("humidityChart"));
  chart.draw(data, options);
}
As new data is pushed to the Google Sheets, we want the graphs to automatically update. To do this, simply call the drawChart() function from the stateChange() function in app.js so every time new data is pushed to the stream the graphs also update.
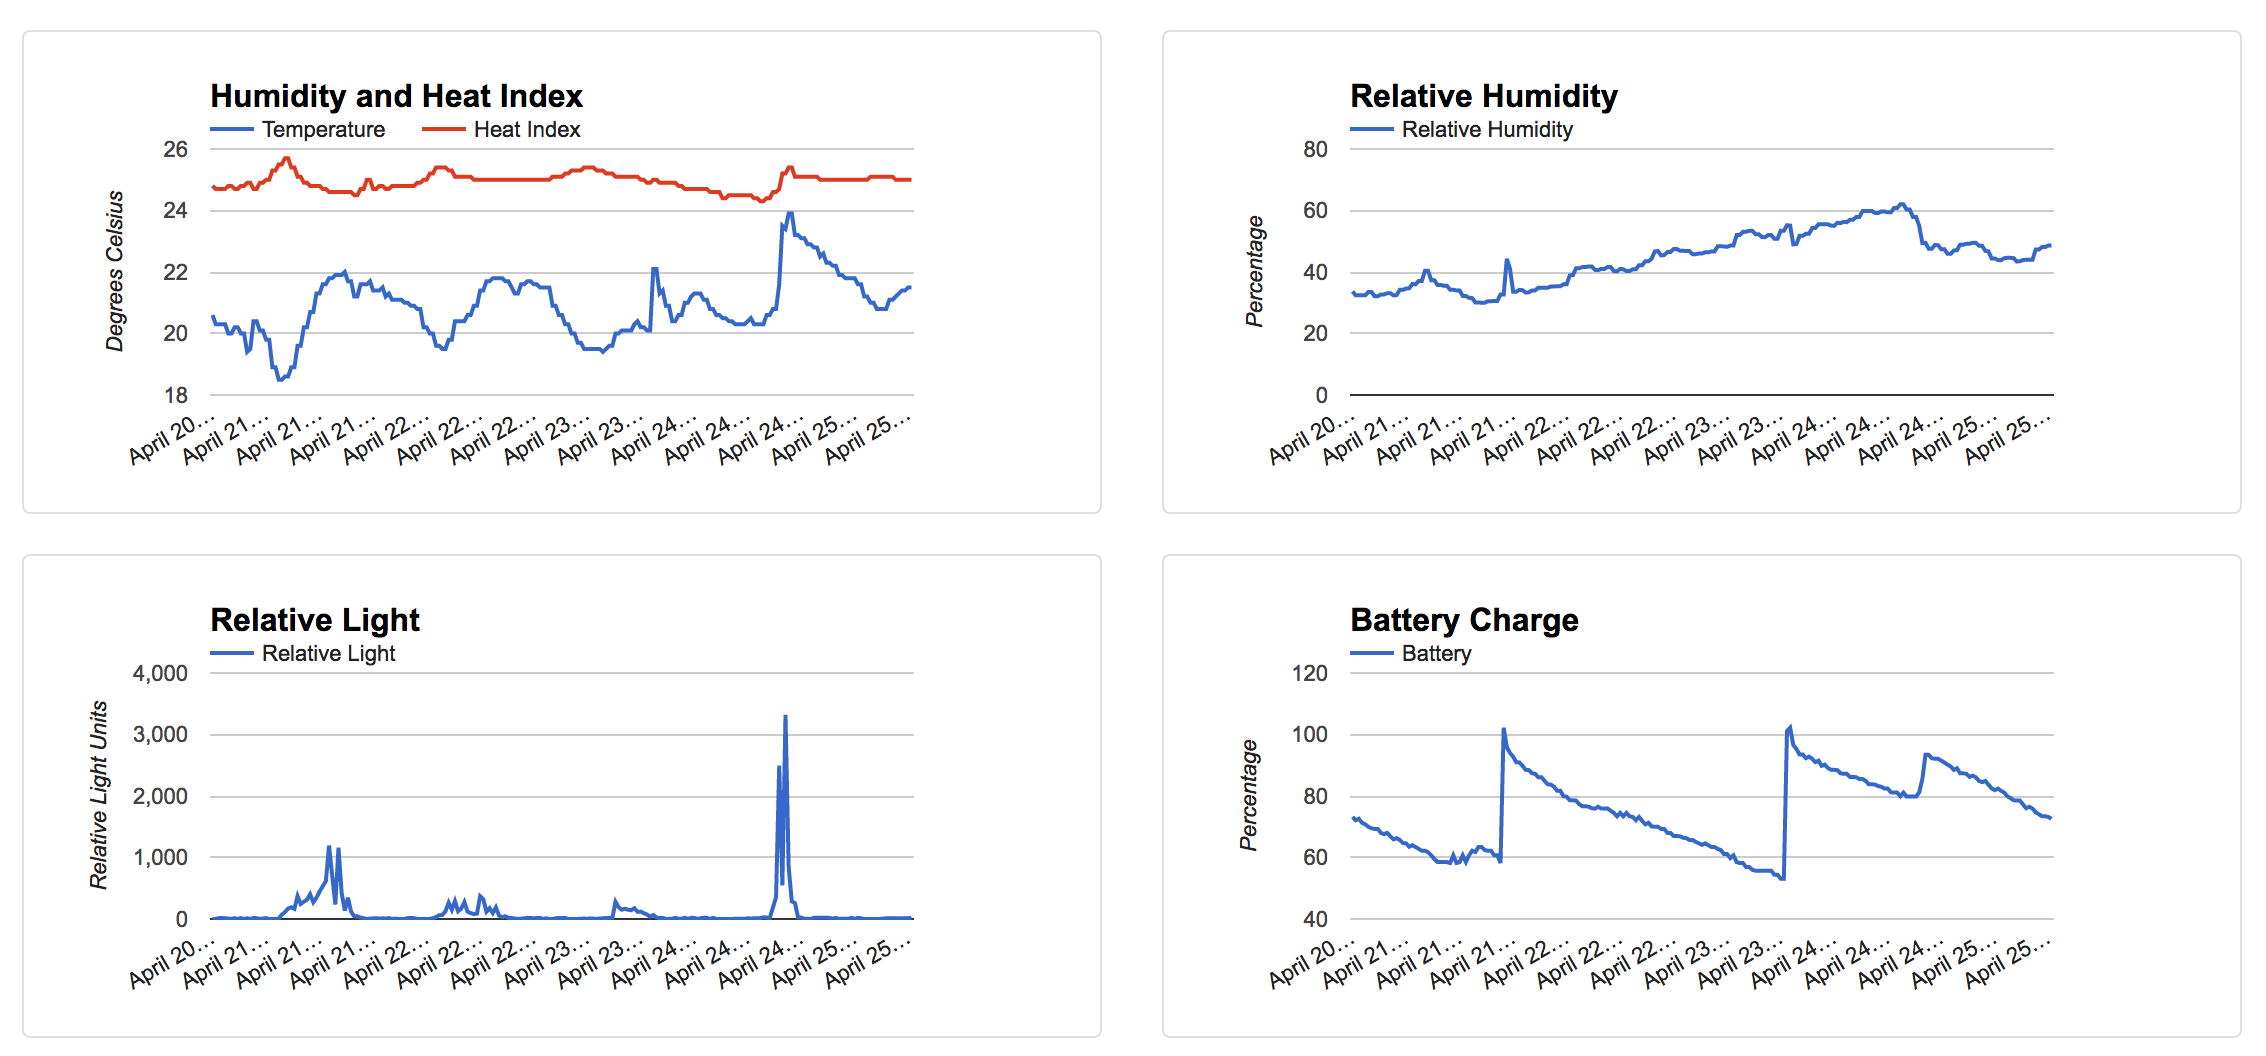
The Remote Environment Monitoring System is complete! Now, every 30 minutes (or more, depending on battery charge) the client will gather humidity, temperature, and relative light data, and send the data as one concatenated String; the server will bounce the received message to the Particle Device Cloud, while also sending an acknowledgment message back to the client; IFTTT will pick up on the new event, parse the information, and write the information to a Google Sheets document; when the web application is opened, it will pull the organized data from the Google Sheets document and display the information in a longitudinal and aesthetically-pleasing manner using Google Charts.
Below is a picture of the graphs shown on the web application after 5 days of monitoring.
Below are pictures of the client and server.