Zhi Shen Yong
My name is Zhi Shen Yong and I am a software developer. Here you can find a few of the projects I have worked on in the past. Please feel free to contact me for any additional information.
20 April 2018
Remote Environment Monitoring System
The Remote Environment Monitoring System allows users to monitor the temperature, humidity, and ambient light of a location, or multiple locations, in a convenient and maintenance-free way.
The simplest system uses two Particle Photon devices. One of these devices is the client, which acts as the remote data collector, periodically sending the data it collects to a central hub. The other device is the server, or the central hub, which continuously listens for incoming messages from clients. The server then uploads the data for a web application to display. A more complex system can use multiple clients.
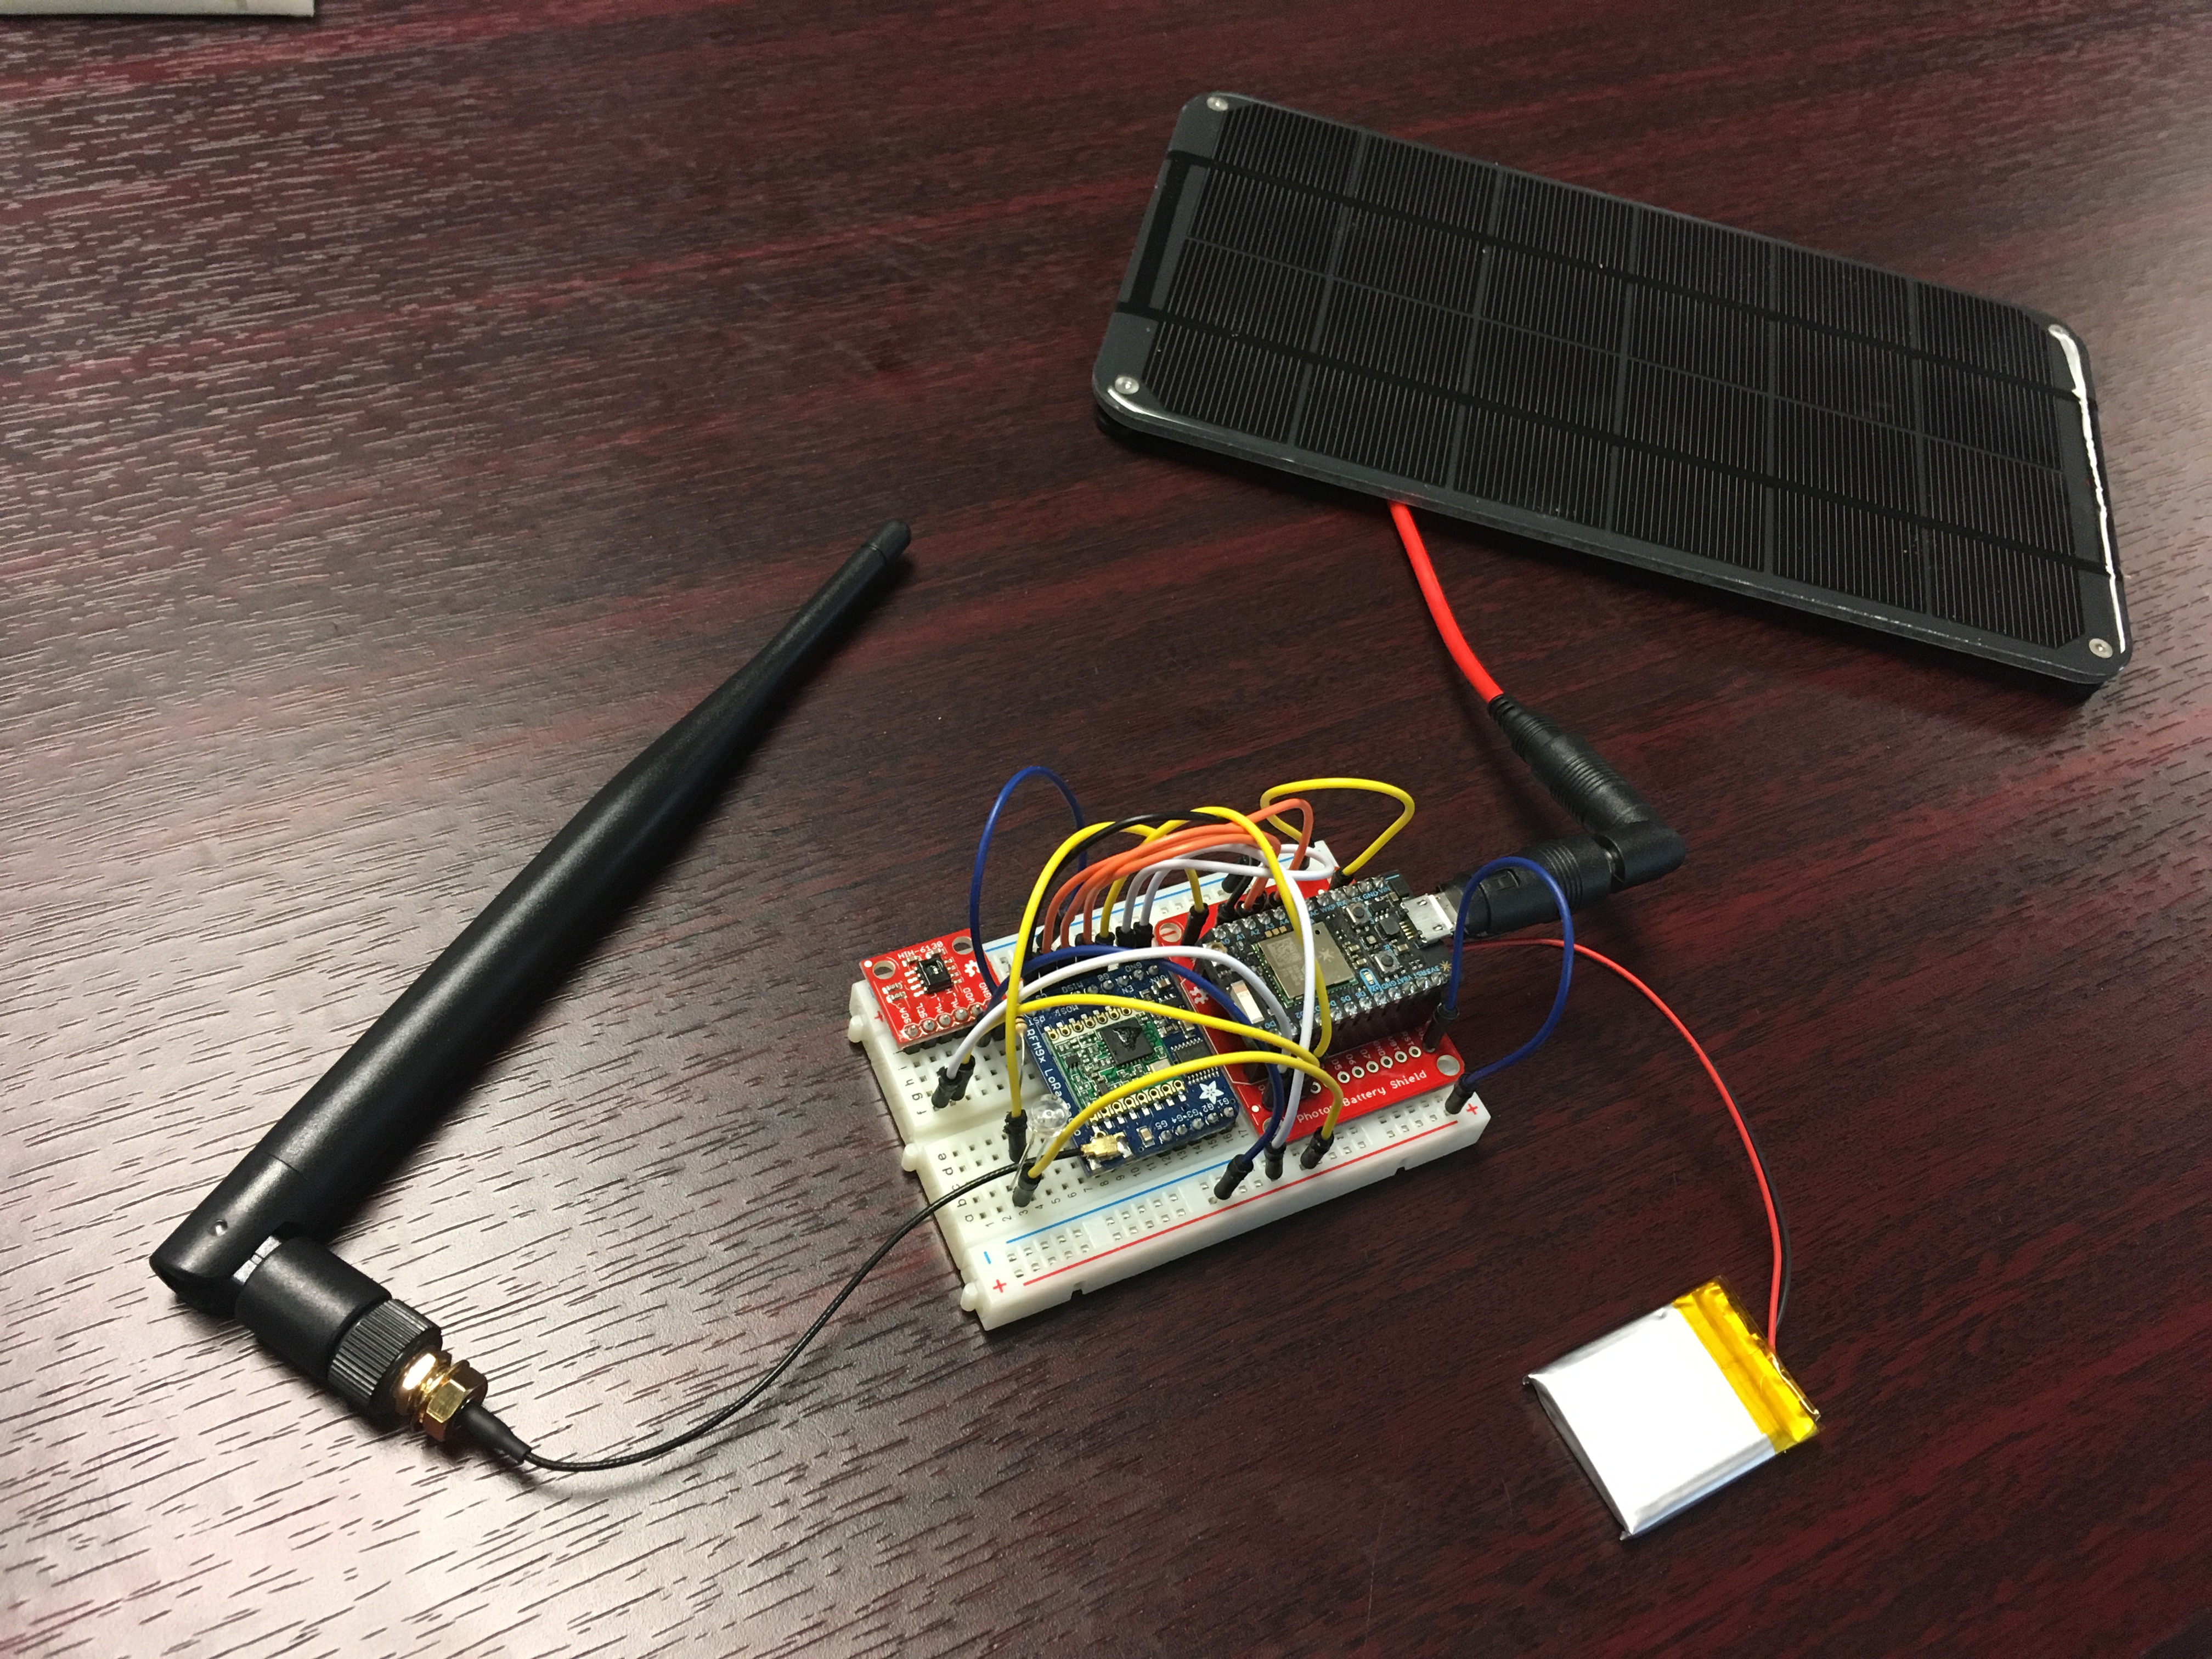
The client is fitted with a number of different sensors for data collection. Here I used a temperature and humidity sensor and an ambient light sensor, but any other kind of sensor, such as a VOC sensor or a LPG sensor, will work. To operate remotely, the client uses a LiPo battery combined with a solar cell to power itself, and uses a LoRaWAN radio transceiver to transmit the information it collections. The LoRaWAN radio transceiver has an approximate range of 2 kilometers in an urban environment.
Below is a picture of the client.
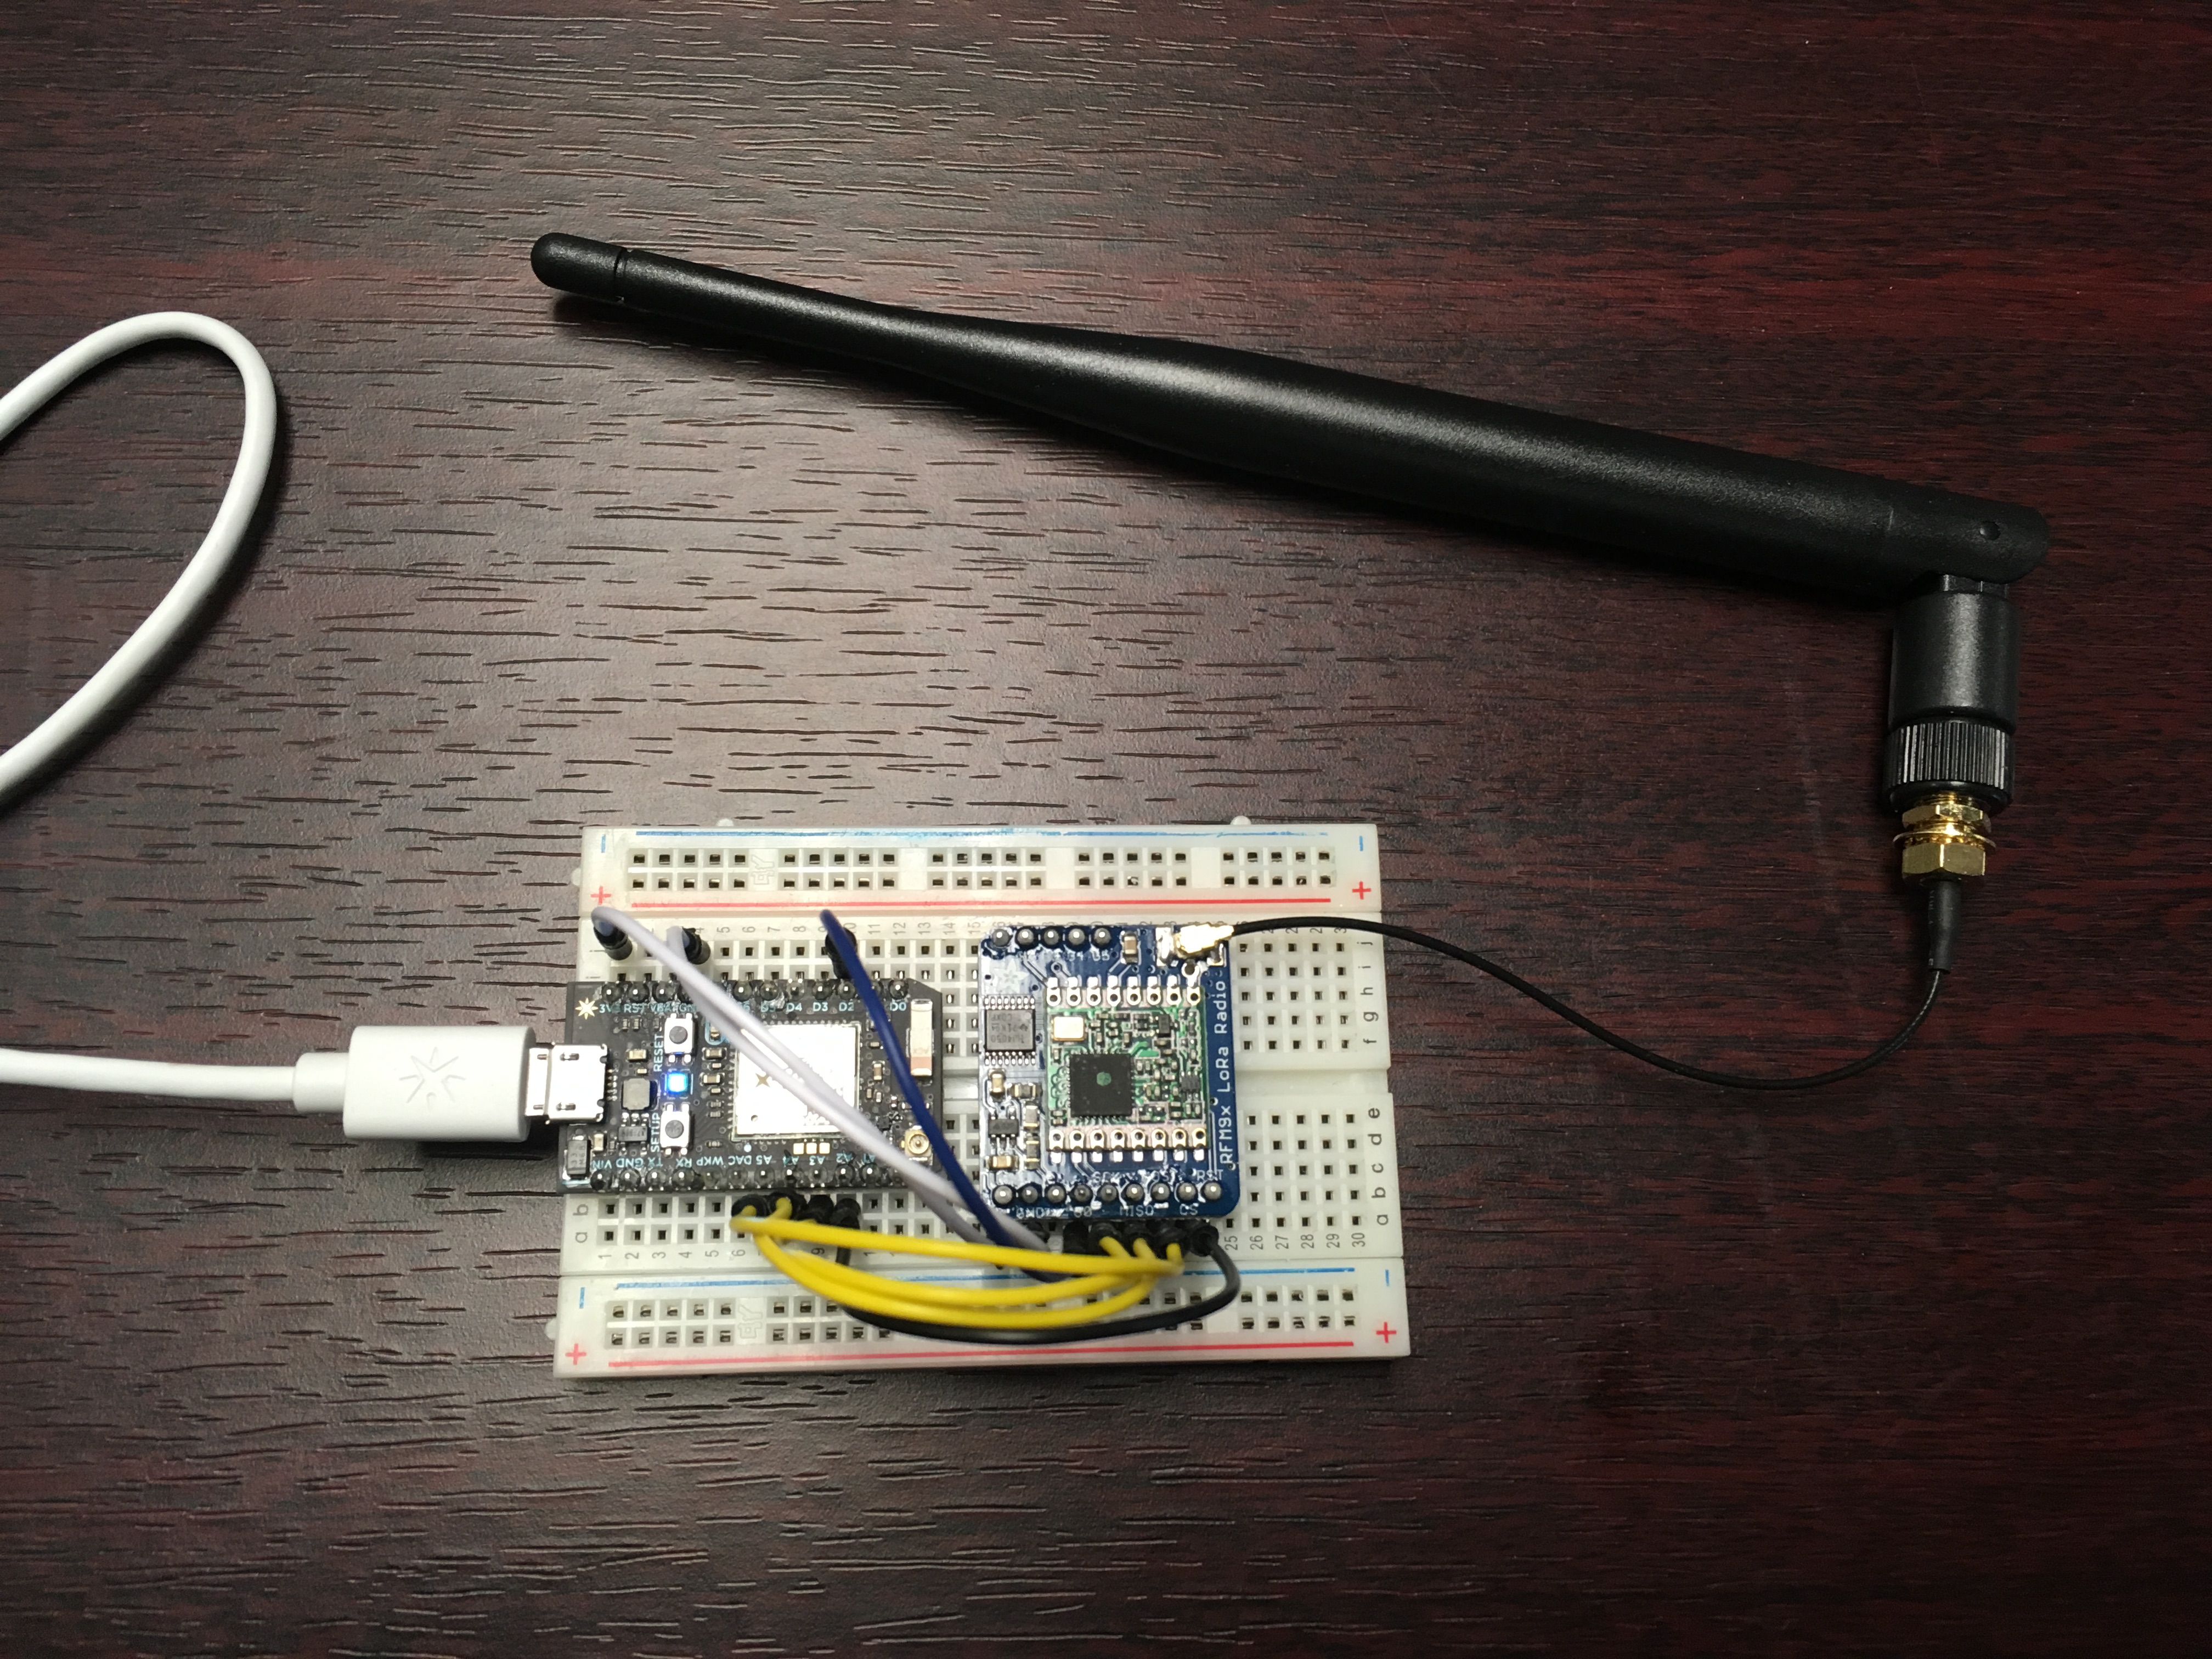
The server, on the other hnd, is fitted with just a radio transceiver to receive messages from clients and send out acknowledgement messages in return.
Below is a picture of the server.
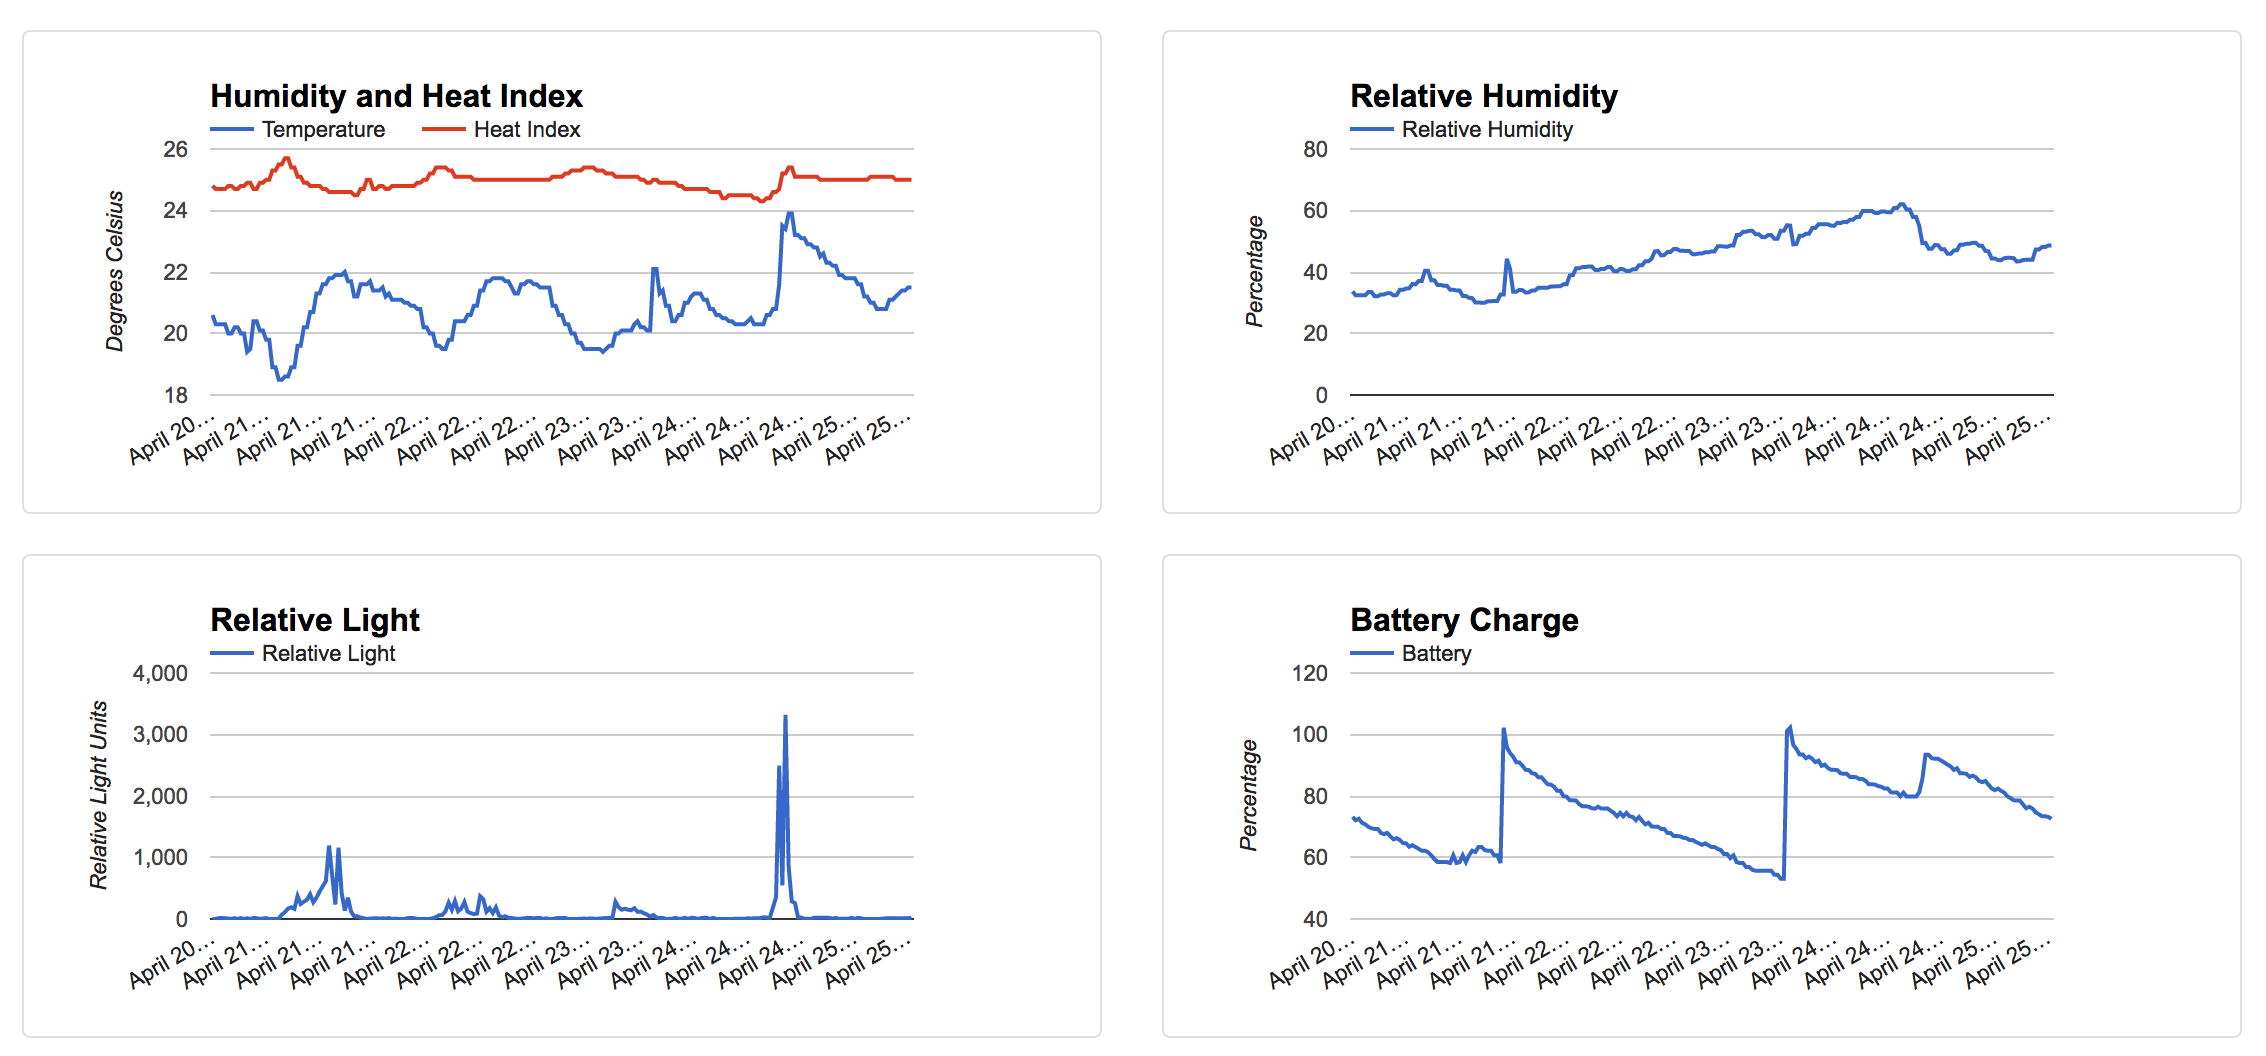
Every 30 minutes (or more, depending on battery charge) the client will gather humidity, temperature, and relative light data, and send the data as one concatenated String to the server; the server will bounce the received message to the Particle Device Cloud, while also sending an acknowledgment message back to the client; IFTTT will pick up on the new event, parse the information, and write the information to a Google Sheets document; when the web application is opened, it will pull the organized data from the Google Sheets document and display the information in a longitudinal and aesthetically-pleasing manner using Google Charts.
Below is a picture of the graphs shown on the web application after 5 days of monitoring.